Norfolk has the 2nd most speeding offences in the UK
18/11/2022 - GoShorty
The research, undertaken by GoShorty, analysed data from a series of Freedom of Information requests and government sources to reveal the areas with the highest number of speed limit offences.
You can view the full research here: https://goshorty.co.uk/blog/car-crime-hotspots/
Top 10 areas for speed limit offences:
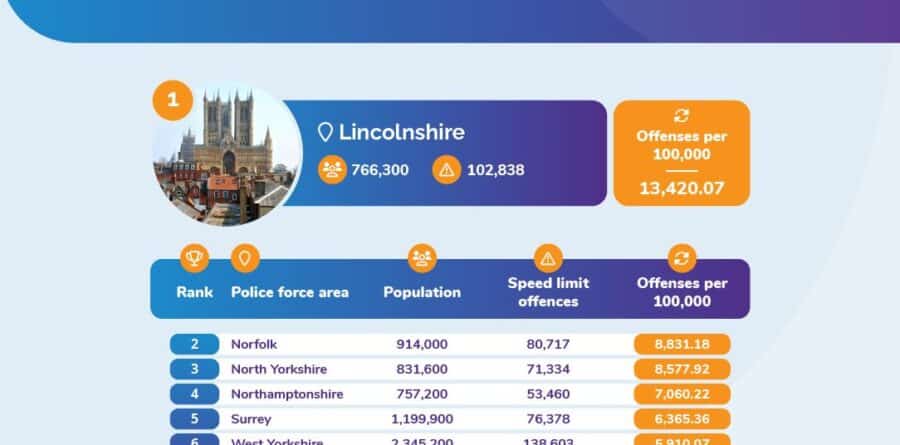
| Rank | Police Force Area | Population | Speed limit offences | Rate per 100,000 |
| 1 | Lincolnshire | 766300 | 102838 | 13420.07 |
| 2 | Norfolk | 914000 | 80717 | 8831.18 |
| 3 | North Yorkshire | 831600 | 71334 | 8577.92 |
Lincolnshire is the UK’s speeding hotspot having recorded the highest per capita rate of speed limit offences in the country, with 13,420.07 offences per 100,000 people. This rate is significantly higher than any other part of the UK, with second place Norfolk recording a rate of 8832.18 offences per 100,000 people.
The research also looked at the most common car crimes in the UK.
The 10 most common car crimes in the UK:
| Rank | Offence | National total |
| 1 | Speeding offences | 1,873,238 |
| 2 | Theft from vehicle | 192,824 |
| 3 | Criminal damage to vehicle | 150,041 |
| 4 | Theft or unauthorised taking of motor vehicle | 89,016 |
| 5 | Vehicle insurance offences | 75,871 |
| 6 | Neglect of traffic directions | 53,797 |
| 7 | Interfering with a motor vehicle | 49,946 |
| 8 | Seat belt offences | 48,170 |
| 9 | Breath test: positive or refused | 43,074 |
| 10 | Careless driving (excluding the use of mobile phone) | 30,167 |
Further findings from the research:
- London saw the most thefts from a vehicle with 687.51 per 100,000.
- Essex has the highest number of seat belt offences with 286.57 per 100,000.
- Thames Valley saw the highest number of parking offences with 144.21 per 100,000 people.
- Cumbria was the area with the most cases of using mobile phones whilst driving, with 80.03 per 100,000.
All articles on this news site are submitted by registered contributors of NorfolkWire. Find out how to subscribe and submit your stories here »